

You’ll want a scorecard that turns every aroma, flavor, acidity, body, balance, uniformity, clean‑cup, sweetness, and overall impression into a 6‑to‑10 rating with 0.25‑point steps. It should lock in sample prep—8.25 g coffee to 150 ml water, coarse grind, 200‑205 °F water, simultaneous pour—so each cup is comparable. Include a confidence‑interval field, origin and roast metadata, and a clear descriptor list for aromas and flavors. The final 100‑point total, broken into subscores, lets buyers, roasters, and producers interpret quality instantly, and the template’s printable and digital versions keep you organized as you explore further.
Define the Coffee Cupping Scorecard’s Purpose

Why does the Coffee Cupping Scorecard matter? It gives you a concrete, repeatable way to compare beans, translating sensory impressions into a numeric SCA scorecard. You assess ten scoring categories—aroma, flavor, aftertaste, acidity, body, balance, uniformity, clean cup, sweetness, and overall—each ranging from 6 to 10 in 0.25‑point steps. Uniformity and the other cup‑by‑cup categories add targeted credits across five cups, ensuring the final score reflects both consistency and peak quality. Calibration, performed through SCA protocols and blind group sessions, keeps every grader on the same page. The resulting final score, typically 86‑89.99 for specialty coffee, guides purchasing, pricing, and communication, while rare 90+ scores signal extraordinary knock box complexity and balance.
Choose a Coffee Cupping Scorecard Scale (SCA 100‑Point vs. Custom)
Ever wonder which scale will give you the most reliable comparison for your beans? You need a scaling system that aligns with your goals. The SCA 100‑point scale offers familiar scoring ranges and a full set of cupping categories, making calibration across labs straightforward. A custom scale can trim categories, adjust point increments, or focus on specific attributes, but it demands rigorous internal consistency checks. In practice, many labs benefit from a documented crosswalk to translate between scales when benchmarking across different tasting sessions or panelists consistent scoring. Affiliate cupping protocols and calibration sessions help ensure that each panelist stays aligned with the chosen framework over time. A hybrid approach can ease transitions during scale changes or comparative studies, allowing teams to retain baseline comparability while incorporating bespoke criteria. Choose the system that preserves consistency while fitting your tasting workflow.
List Mandatory Evaluation Categories and Point Ranges
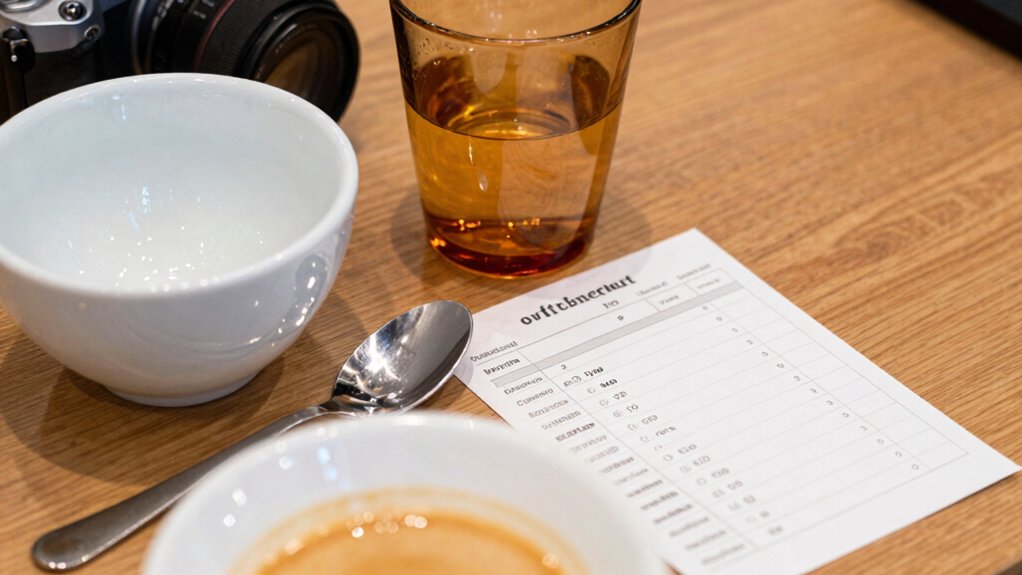
Choosing a scale sets the stage for the next step: defining the mandatory evaluation categories and their point ranges. You’ll score each attribute on a 0‑10 scale, using 0.25 increments, and then sum them for a Final Score out of 100. The ten required categories are Fragrance/Aroma, Flavor, Aftertaste, Acidity, Body, Balance, Uniformity, Clean Cup, Sweetness, and Overall. Uniformity, Clean Cup, and Sweetness are judged cup‑by‑cup across five cups, with full credit (10 points) only when all cups meet the criterion. Typical specialty cuppers aim for 7.25‑9 points per category, pushing the Final Score into the Outstanding or Excellent range. Display and build
Standardize Sample Preparation: Ratio, Grind, Water Temp, Timing
You’ll start by measuring 8.25 g of coffee for every 150 ml of water, keeping the ratio exact for every bowl.
Then you’ll grind the beans to a uniform coarse texture, ensuring each cup brews the same way.
Finally, you’ll heat the water to 200–205 °F and pour it at the same moment, so timing never varies.
To ensure consistency, consider using a fixed-emissivity setting for uniform surface readings during calibration emissivity consistency.
Consistent Coffee‑to‑Water Ratio
By keeping the coffee‑to‑water ratio at 8.25 g per 150 ml, you guarantee every cupping sample has the same strength, which lets the aroma, flavor, and mouthfeel differences shine without the noise of varying dilution. A stable ratio anchors the coffee cupping process, ensuring that each brew follows the same cupping protocol and that aroma assessment reflects true bean characteristics rather than concentration shifts. It also simplifies comparisons across batches, because the only variables left are grind size, water temperature, and timing. When you control the ratio, you remove a major source of inconsistency and let subtle nuances emerge. Maintaining a consistent ratio supports reliable measurements across different sets and equipment, especially when using standardized equipment like a scale and thermometer ratio standard.
- Weigh coffee precisely to 8.25 g.
- Measure water to 150 ml at 200–205 °F.
- Record the ratio on every scorecard.
Uniform Coarse Grind Size
Why settle for uneven extraction when a uniform coarse grind can lock in consistency? You’ll notice that a uniform grind size eliminates surface‑area variance, letting the cupping protocol deliver reliable extraction consistency across every bowl. By grinding each sample to the same coarse texture, you reduce channeling and over‑extraction, which otherwise skew aroma and flavor notes. This grind uniformity keeps the pre‑infusion and crust‑break steps predictable, so each slurp reflects the coffee’s true character. Additionally, aligning the resulting grind with precise timing and a stable water temperature helps ensure that the overall process minimizes variability across different devices and setups grind uniformity. When you follow the standardized ratio and timing, the sensory evaluation becomes a true comparison of beans, not a test of preparation skill. Consistently applying these controls ensures your scorecard reflects genuine quality differences, not procedural noise.
Precise Water Temperature Timing
Ever wondered how a few degrees can make or break a cupping? You’ll find that water temperature and timing are the twin pillars of brew control. When you keep the brew at 200‑205°F (93‑96°C) and stick to a strict timing schedule, you eliminate drift that would otherwise blur aroma and flavor notes. This precision fuels consistency across the cupping protocol, letting you compare scores confidently. Additionally, using filters with consistent pore size helps maintain uniform extraction across samples paper micro-filters for cleaner, more comparable profiles.
Create Aroma & Flavor Descriptors for the Scorecard
What aromas and flavors will you capture on the scorecard? Choose aroma descriptors that separate dry fragrance from wet aroma, using terms like fruity, floral, nutty, and earthy. Pair them with flavor descriptors such as chocolate, caramel, citrus, and spice, noting intensity and balance. Align each term with SCA scoring guidelines so that every cupping attribute receives a 0‑10 rating in 0.25 increments. Record uniformity across five cups, and run consistency checks to verify that the same descriptors appear in each sample. This systematic approach ensures that aroma and flavor scores reflect true specialty quality, support accurate overall cup evaluation, and provide a reliable foundation for the final 100‑point total.
Spot Defects and Apply Deductions
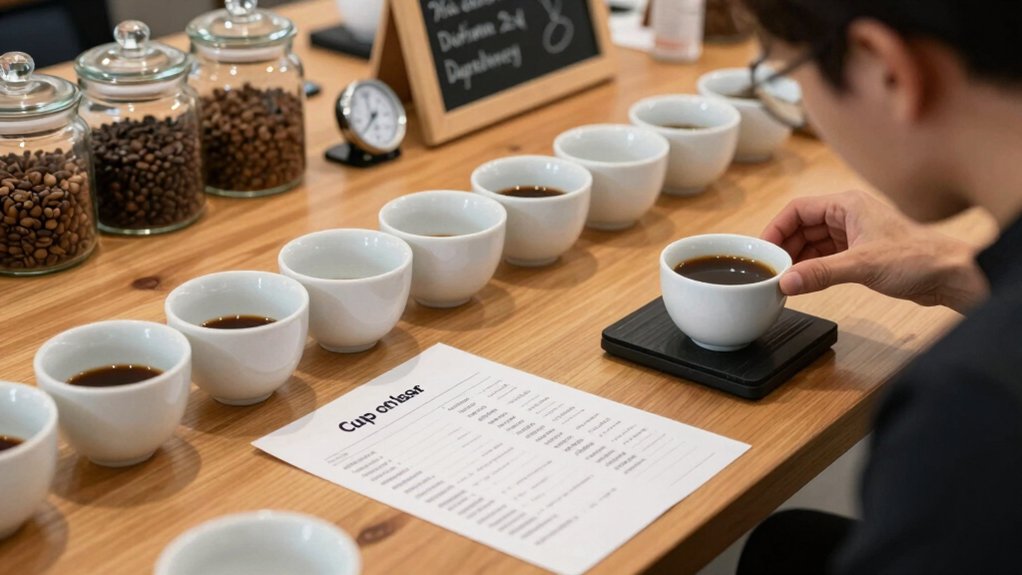
When you spot a defect in any of the five cupping samples, you immediately apply the prescribed multiplier—2× for minor issues, 4× for major faults—to the number of affected cups, then subtract that product from the overall score. This deduction directly lowers the cupping scorecard total and signals a failure in taint detection, which is essential for reliable uniformity across the set.
Apply multiplier×× or 4× to affected cups, subtract from total, and flag taint detection failure.
- Identify each defect type—off‑flavor, foreign matter, or processing error—before tallying cups.
- Apply the correct multiplier based on severity, then calculate the deduction.
- Record the resulting score, noting how the defect impacted uniformity and overall qualification.
Record Uniformity, Clean Cup, Sweetness, and Overall Impression
A solid cupping score hinges on four key elements—uniformity, clean cup, sweetness, and overall impression—each recorded cup‑by‑cup and then summed into its respective subscore. You’ll note uniformity by checking that all five cups taste alike; any deviation drops points from the 0‑10 range. For clean cup, you confirm that each sip is free of off‑flavors, a,, or a clean‑cup siping 10‑point subscore. Sweetness requires you to detect pleasant, balanced sweetness in every cup; consistent sweetness earns the full ten points. Finally, overall impression captures your holistic view of aroma, flavor, body, balance, and finish, translating into another 0‑10 subscore. Together, these four metrics form the core of SCA scoring, guiding you toward an accurate, repeatable total score.
Add a Confidence‑Interval Field for Score Variability
How can you capture the natural variability in cupping results? Adding a confidence‑interval field to your cupping form boosts data reliability by quantifying score variability. It lets you report SCA cupping scores as a range, not a single point, so stakeholders see the precision of your assessment.
Capture natural variability by adding a confidence‑interval field, turning single scores into precise ranges.
- Collect multiple replicates – Run each coffee at least three times, recording each attribute’s subscores.
- Calculate the mean and standard error – Use the replicates to derive a 95 % confidence interval for the total score.
- Display the interval on the scorecard – Show “Score = 86 ± 2” so readers understand the variability.
This approach clarifies how lab‑to‑lab differences affect rankings and makes your cupping form a stronger, more trustworthy tool.
Add Origin & Roast Metadata to the Scorecard
Why does origin and roast data matter? Because without those details the cupping scorecard can’t tell you why a coffee tastes the way it does or how to compare it across batches. You should embed origin metadata—country, region, farm, lot—right alongside roast metadata like roast level and batch date. This pairing lets you link sensory scores to provenance, making it easy to see how a specific terroir or roast profile drives flavor.
Use a standardized vocabulary or code system so everyone—buyers, roasters, cuppers—interprets the fields the same way. When the cupping scorecard includes these data points, you gain traceability, improve batch‑to‑batch comparability, and support pricing, inventory, and supplier decisions with clear, actionable insight.
Explain Score Interpretation for Buyers, Roasters, Producers
Ever wondered how a cupping scorecard translates into actionable insight for each stakeholder? You’ll see that cupping scores become a roadmap: buyers gauge value, roasters plan profiles, and producers showcase progress. Score interpretation hinges on the SCA scorecard’s 100‑point scale and the 6–10 point increments per attribute, while uniformity and clean cup credits sharpen quality consistency.
- Buyers – Use the 80‑90 range to spot entry‑level versus rare beans, adjusting for origin and processing to balance price and expectation.
- Roasters – Target lots scoring 87‑89+ for complex flavor potential, then align roast degree and freshness to your target cup.
- Producers – Highlight upward trends in uniformity and clean cup scores to justify premium pricing and demonstrate cultivation improvements.
Offer Printable and Digital Versions of the Scorecard Template
You’ll appreciate the Easy‑Print PDF template that lets you hand‑write scores while keeping the layout clean for labs and roasteries. The Interactive Scoring Spreadsheet automates calculations, so you can instantly see totals and spot outliers. And the Mobile‑Friendly Scorecard App lets you record each cup on the go, syncing data across devices for seamless collaboration.
Easy‑Print PDF Template
Looking for a hassle‑free way to record SCA cupping results? Our easy‑print PDF template gives you a ready‑to‑use cupping scorecard that aligns with standardized scoring and covers all SCA attributes. Print it on cardstock or keep a digital copy on your tablet; the layout mirrors the 100‑point scale, so you never miss a 0.25 increment.
- Instant access – download the PDF and start cupping without setup delays.
- Clear sections – each attribute (Fragrance/Aroma, Flavor, Acidity, etc.) has its own row, making uniformity and clean‑cup credits easy to track.
- Portable design – the file fits a standard A4 sheet, so you can file it in a binder or share it with teammates for consistent calibration.
You’ll capture every cup’s score quickly, ensuring reliable data for purchasing decisions and quality communication.
Interactive Scoring Spreadsheet
Want a seamless way to log each cup while still being able to tweak formulas on the fly? An interactive scoring spreadsheet lets you enter raw SCA cupping data and instantly calculate the 100‑point total. You fill in the ten flavor attributes—Fragrance/Aroma, Flavor, Aftertaste, Acidity, Body, Balance, Uniformity, Clean Cup, Sweetness, and Overall—using 0.25‑point increments. The sheet auto‑averages the five cups for Uniformity and Clean Cup, flags any defects, and applies the scoring system thresholds (80+ Specialty, 85‑89.99 Excellent, 90‑100 Outstanding). Printable PDFs keep a paper record, while the digital version updates formulas instantly, so you can experiment with weighting or adjust for calibration without re‑typing scores.
Mobile‑Friendly Scorecard App
How can you capture a full SCA 100‑point cupping assessment on a phone without sacrificing detail? A mobile‑friendly scorecard app replicates the SCA 100-point framework, letting you log ten attributes—fragrance aroma, flavor, aftertaste, acidity, body, balance, uniformity, clean cup, sweetness, and overall—in 0.25‑point increments. The interface stays crisp on small screens, and a printable PDF mirrors the digital layout for offline work. Calibration rows let you add reference samples and notes, ensuring consistent scoring across sessions. Guidance on brew ratios, water temperature, and tasting steps keeps your mobile cupping aligned with professional protocols.
- Tap to enter scores instantly.
- Swipe to view calibration notes.
- Export or print the completed card.
Frequently Asked Questions
How Often Should the Scorecard Be Updated for Seasonal Coffee Variations?
You should refresh the scorecard every season—roughly every three months—to capture flavor shifts, bean origins, and roast adjustments, ensuring your evaluations stay relevant and accurate.
Can the Scorecard Accommodate Non‑Arabica Varieties Without Bias?
You can adapt the scorecard for non‑arabica beans by adjusting aroma, flavor, and body descriptors, removing Arabica‑specific references, and weighting attributes equally so bias doesn’t skew your evaluations.
What Training Is Required for Consistent Defect Identification Across Tasters?
You’ll need a structured program covering sensory fundamentals, defect taxonomy, blind‑testing drills, and regular calibration sessions, so you and your team consistently recognize and rate defects the same way.
How Does Storage Condition Data Influence the Confidence‑Interval Field?
You’ll see the confidence‑interval field narrow when storage condition data is consistent and precise, because you can directly link moisture, temperature, and exposure to flavor stability, reducing variability.
Is There a Recommended Digital Platform for Real‑Time Collaborative Scoring?
You should try CuppingHub, a cloud‑based app that lets you and teammates log scores instantly, sync data in real time, and generate shared reports, all with a simple, intuitive interface.
In Summary
By using a clear purpose, a consistent scale, and mandatory categories, you’ll capture every nuance of a cupping. Standardizing brew ratios, grind, water temperature, and timing removes variability, while detailed aroma and flavor descriptors keep language precise. Adding a confidence interval and origin/roast metadata lets you track consistency and provenance. Finally, interpreting scores correctly empowers buyers, roasters, and producers to make informed decisions—whether on paper or digitally.


