

Start by picking software that blends GIS data with a 5‑dimensional flavor vector so you can see taste profiles anchored to exact lat‑long points. Make sure it lets you tag each ingredient with provenance fields like harvest date and processing method, and that it supports versioning so you can roll back or compare changes. Look for interactive terroir maps that let you filter by sour, umami, or any flavor dimension in real time. Verify that privacy controls let you set consent at the item level, encrypt data, and log every access. Keep reading to discover more details on each tip.
Understand Core Concepts of GIS-Enabled Flavor Mapping
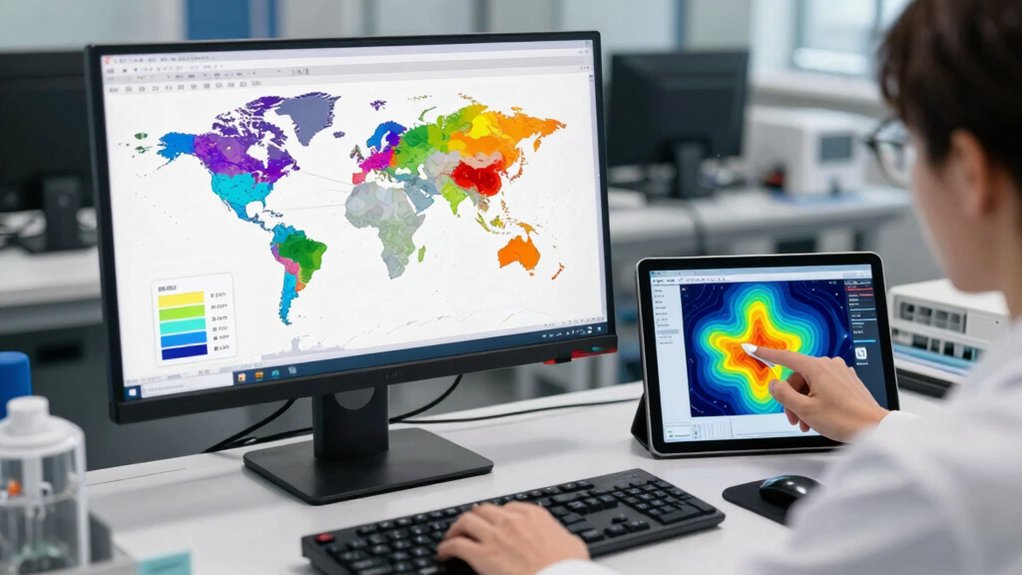
So, what exactly is GIS‑enabled flavor mapping? You blend GIS with sensory data, turning taste profiles into geographic visualizations. The system ties terroir‑specific flavors to exact locations, letting you see which regions produce the notes you crave. By overlaying flavor mapping on interactive maps, you can explore, categorize, and compare origins in real time. Role‑based workflows let producers upload their sensory data while buyers filter for specific flavor attributes, enabling transparent, origin‑based sourcing. You’ll spot patterns—like Central American cocoa’s bright acidity—without digging through spreadsheets. The platform’s digital maps become your decision engine, turning complex flavor data into actionable insights for specialty markets. This concise core concept powers efficient, data‑driven sourcing, with scalable filters that support geospatial tagging across multiple origin datasets.
Choose the Right GIS-Enabled Data Model for Flavor Mapping
Now that you grasp how GIS turns taste profiles into visual maps, the next step is picking a data model that can bind each geographic point to a rich, multi‑dimensional flavor vector. Choose a GIS data model that stores latitude‑longitude pairs alongside a 5‑D sensory profiles array, letting you slice by region, variety, or attribute. Ensure the schema records provenance fields—origin, harvest date, processing method—so every flavor mapping entry can be traced back to its source. Design for scalability: index spatial data, cache vector calculations, and allow dynamic updates without rebuilding the whole map. A farm’s plot linked to a spice’s sweet‑bitter‑umami vector data provenance can be analyzed across harvest dates and processing methods. A vineyard’s terroir node displaying acidity, body, and aroma scores. A regional heatmap overlaying sensory profiles with provenance tags
Track Provenance and Version Flavor-Mapping Profiles
How can you guarantee that every flavor‑mapping update remains traceable and reproducible? By embedding provenance tracking directly into your flavor‑mapping profiles, you record each ingredient’s source, the underlying flavor‑molecule data, and every model‑training run. Versioning stores each change as a new node or edge in the flavor graph, so you can roll back or compare revisions instantly. Transparency comes from publishing the full data trail on GitHub, letting peers validate the historical context of any pairing.
| Component | Provenance Detail | Versioning Action |
|---|---|---|
| Ingredient node | Source ID & lab report | New node on update |
| Molecule edge | Chemical assay link | Edge weight revision |
| Recipe profile | Training dataset snapshot | Profile version bump |
| Pairing rule | User feedback log | Rule adjustment record |
| Exported vector | Timestamped checksum | Immutable archive |
Use this workflow to keep every flavor‑graph alteration auditable and reproducible.
Visualize Flavor Vectors on Interactive Terroir Maps
Embedding provenance into each flavor‑mapping profile gives you a reliable data backbone, and the next step is to turn that structured information into a visual experience.
Embedding provenance into each flavor‑mapping profile creates a reliable data backbone for visual, interactive tasting maps.
A robust data backbone supports shelf stability considerations when mapping flavor vectors across regional terroirs, ensuring the visualization remains accurate over time. You load the 5‑dimensional flavor vectors—spicy, sweet, umami, sour, salty—onto an interactive terroir map. The software plots each ingredient as a colored node, then clusters nodes by region so you can instantly see how geography shapes taste. As you drag a slider to boost sour or lower umami, the map redraws in real time, letting you explore alternative pairings without leaving the screen.
- A heat‑map overlay that glows where sweet intensity peaks across vineyards.
- Pinpoint icons that expand into radial bars representing each flavor dimension.
- Dynamic region outlines that tighten around clusters of similar flavor profiling.
This interactive visualization sharpens flavor profiling, speeds decision‑making, and turns raw data into an intuitive, geographic taste atlas.
Implement Privacy Controls for Shared Flavor Mapping Data
Why should you worry about privacy when sharing flavor‑mapping data? You’re handling sensitive taste profiles that can reveal proprietary blends or personal preferences. Implement privacy controls by letting users consent to data sharing at item, category, and profile levels. Apply data minimization—store only essential 5‑D vectors, source, timestamp, and access rights—to limit exposure. Encrypt the data at rest and in transit, then enforce role‑based access control so only authorized personnel see the flavor mapping details. Provide transparent access logging and tamper‑evident audit trails so users can see who accessed their data and when. Offer opt‑in sharing for collaborative experiments, accompanied by clear privacy notices and an easy way to revoke access whenever needed.
Frequently Asked Questions
What Are the 7 Flavour Profiles?
You have seven flavor profiles: sweet, sour, salty, bitter, umami, spicy, and a balanced “neutral” mix. Each reflects a dominant taste dimension you can target when mapping ingredients to user preferences.
What Are the 5 Flavors Profiles?
You’ve got five flavor profiles: spicy, sweet, umami, sour, and salty. Each ranges from zero to one, letting you map any dish’s taste vector and compare it across recipes instantly.
How to Create a Flavor Profile?
You’ll start by listing each ingredient, then assign its spicy, sweet, umami, sour, and salty values between 0 and 1, average those vectors across the dish, and store the resulting 5‑dimensional profile.
How to Balance Flavor Profiles?
You balance flavor profiles by averaging each category’s ingredient vectors, then adjusting weights based on feedback; increase similarity scores for liked dishes, decrease for disliked, and fine‑tune the 5‑D dimensions accordingly.
In Summary
You’ve now got the basics to turn raw taste data into actionable insights. By mastering GIS‑enabled flavor mapping, picking the right data model, tracking provenance, visualizing vectors on terroir maps, and locking down privacy, you’ll create robust, shareable flavor profiles. Keep iterating, stay precise, and let the maps guide your next product decisions.


