

Use a calibrated color meter to track Maillard and caramelization instead of relying on temperature alone. Take a quick post‑tray reading for a stable baseline, then add periodic real‑time scans to catch rapid shifts. Pair whole‑bean and ground‑sample RGB or Agtron values with weight‑loss data to flag drift and ensure uniformity. Keep grind size, tray dose, and repeat measurements consistent, and build a roast‑color library tied to flavor cues. Continue, and you’ll discover how to fine‑tune each batch.
Why Color Beats Temperature in Roast Control
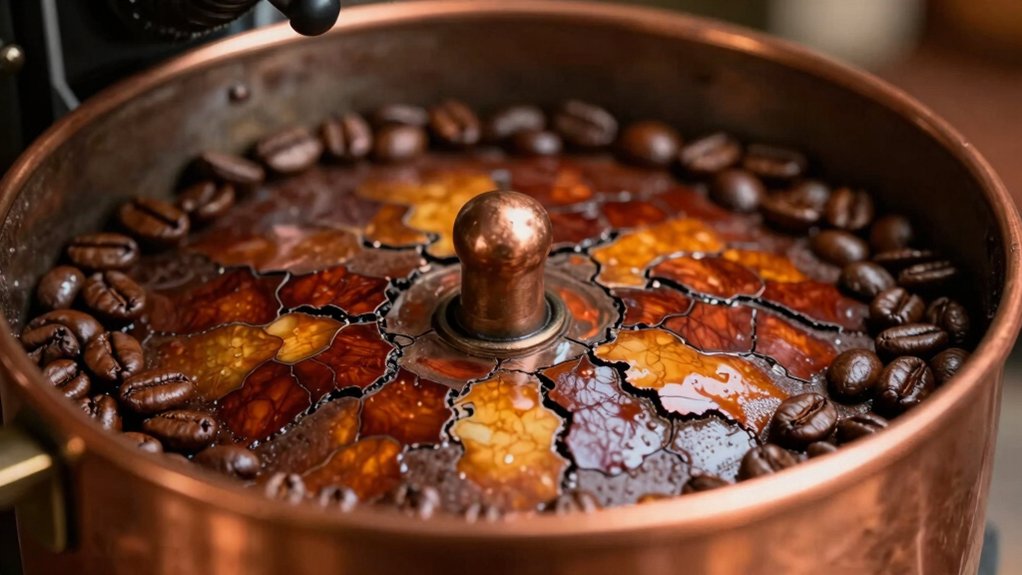
Why does color trump temperature when you control a roast? You watch roast color shift, knowing the Maillard and caramelisation reactions are happening, while temperature alone can’t tell you if the interior has caught up. Color gives you a direct, visual cue that the bean’s chemistry is progressing as expected, so you can tweak the fire or airflow instantly.
Studies show that relying on roast color lets you adjust faster and compare results across different roasters, even when their Temperature profiles vary. Real‑time color tracking tools, like OmniFlux, let you build a profile around color change rather than chasing a temperature curve.
After the batch, measuring bean surface and ground color provides a stable reference for quality control and flavor analysis. This approach makes your roast more consistent and your flavor predictions more reliable. Filter choices influence the perceived brightness and body of the cup by altering how much of the bean’s surface chemistry is carried into development.
How to Pick the Right Color Meter for Your Setup
Ever wondered which color meter will give you reliable, repeatable readings without breaking your budget? Start by ranking consistency and accuracy; ground‑trainable devices win because they hold steady across sessions. Check whether the meter supports real‑time tracking like OmniFlux’s color‑trace and cooling‑curve features—these boost rapid feedback for larger batches.
Match the sample tray size to your operation: a 100‑g tray smooths volatility, but if waste is a concern, a smaller tray works if the meter’s sensor is sensitive enough. Pair the meter with a low‑retention grinder to eliminate chaff interference and keep grind uniform. Finally, plan regular recalibrations—ideally before each roast and whenever readings drift—to preserve QC integrity and keep your color meter delivering trustworthy data.
Balancing Sample Tray Size Against Waste and Stability
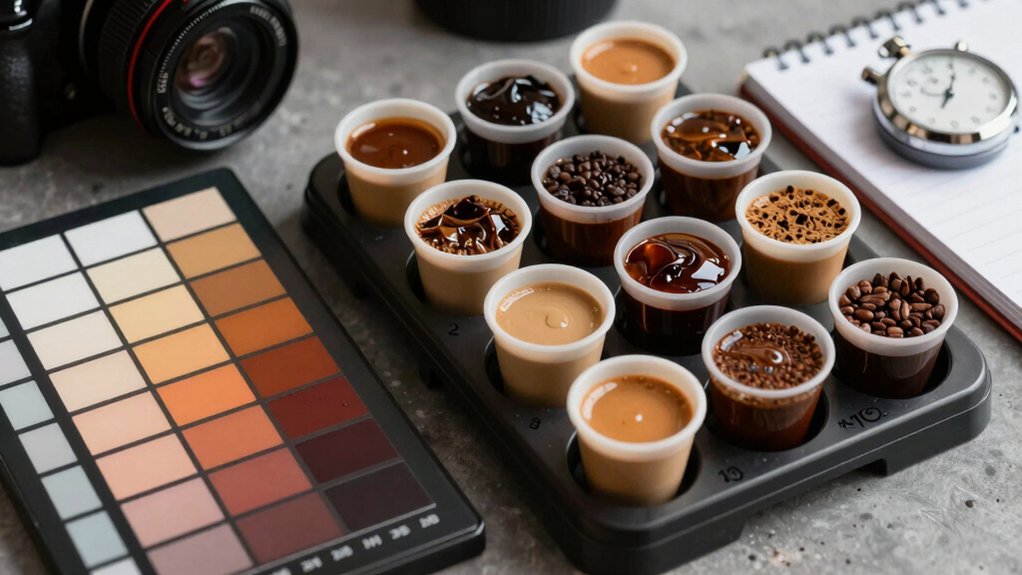
How do you decide between a 100 g tray that steadies readings and a smaller one that cuts waste? You weigh roast color stability against cost. A 100 g tray gives a broad surface, smoothing out variability and delivering reliable color data, but it forces you to waste more coffee each run. The choice also benefits from considering material durability and compatibility with standard equipment typical of cafe workflows stainless steel tips and how easy it is to clean between batches. A compact tray conserves beans, yet the reduced sample height amplifies noise, often prompting extra batches to achieve the same confidence level. Use the same grind and a low‑retention grinder to keep results comparable, regardless of size.
Remember that ground measurements need more coffee to lock in color, while whole‑bean checks can serve as a reference. Over many roasts, the cumulative waste from larger trays may outweigh their initial stability advantage.
Grind Size and Retention for Accurate Roast Color
When you aim for reliable roast‑color data, the grind size and grinder retention become the linchpins of consistency. Use a dedicated small grinder that holds just enough grounds for a single reading; low grind retention prevents cross‑contamination and chaff from skewing results. Stick to the same grind size for every measurement—finer particles reduce chaff interference, while a coarse setting introduces variability. Tamp the ground sample to create a smooth, even surface, which yields uniform color readings across the tray. Because many devices consume roughly 100 g per analysis, maintaining grind size consistency limits waste and stabilizes the data. By controlling grind retention and ensuring a repeatable grind size, you guarantee accurate, repeatable roast‑color measurements. A smart, temperature‑lit reading process can further improve data reliability by keeping the sample within a stable thermal window temperature stability.
When to Take Your Color Reading: Cooling Tray vs. Real‑Time Scan
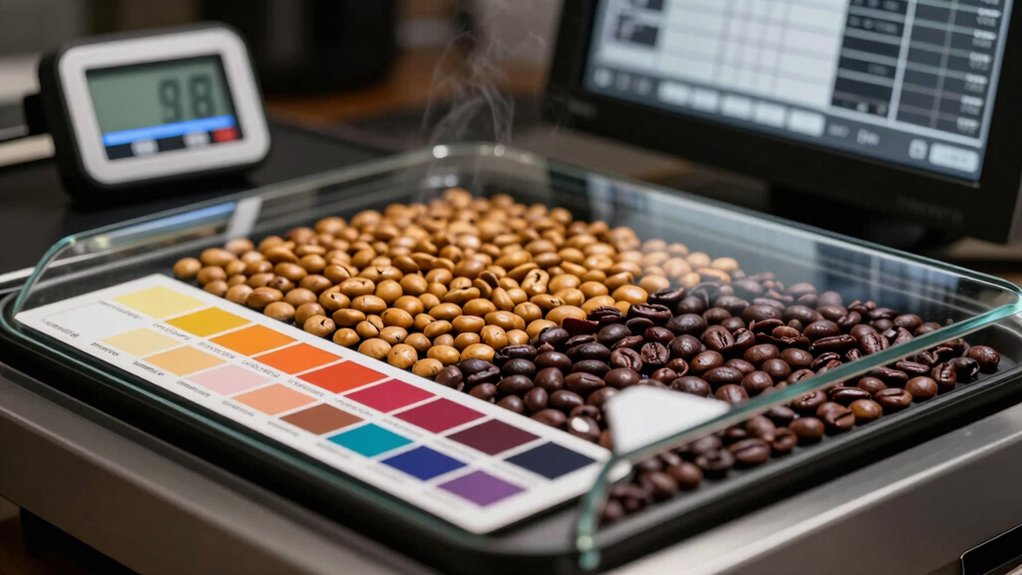
Consistent grind size and low retention set the stage for reliable color data, but the moment you capture that data matters just as much. When beans hit the cooling tray, you lock in a stable Roast color snapshot that reflects the full heat cycle and weight loss. Real-time scans with OmniFlux give you a dynamic view during the roast, useful for spotting rapid shifts, but they can be jittery because temperature and airflow still fluctuate. By pairing a quick post‑tray read with periodic live scans, you create a robust timeline that validates both immediate trends and final outcomes. Using a companion set of calibrated scales, such as the Maestri House Digital Coffee Scale with Timer (USB‑C) or BOOKOO Coffee Scale with Timer and Bluetooth Connectivity, ensures consistent weight loss data aligns with Roast color readings, reinforcing reliability across sessions calibrated scales. Capture color immediately off the cooling tray for stable baseline. Use real-time scanning to monitor rapid changes during first‑crack. Cross‑check whole‑bean and ground readings to align weight loss with Roast color.
Quick Steps to Recalibrate Your Meter Before Each Roast
Before you start roasting, check the manufacturer settings to confirm the meter’s baseline. Make sure the sample tray is spotless and then run a standard reference sample to verify accuracy. This quick routine catches drift early, keeping your color readings reliable batch after batch. Also, ensure your device’s temperature compensation (ATC) is functioning correctly for consistent results across roast profiles ATC accuracy.
Check Manufacturer Settings
How often do you verify that your meter’s manufacturer settings match the current batch? You should check them before every roast to keep Color readings reliable and the Rate of Rise consistent. A quick glance at the firmware version, default calibration curves, and temperature compensation settings can reveal mismatches that skew your data. If the settings differ from the batch’s profile, recalibrate the meter using your standard weight‑loss and color cross‑checks. Log any adjustments so you can spot drift over time and maintain QC integrity. Third‑party verification helps ensure your readings stay trustworthy across batches.
- Confirm firmware and calibration curve version matches batch specifications.
- Verify temperature compensation and sensor offsets are set for the current roast.
- Record any changes and outcomes in your calibration log.
Verify Sample Tray Cleanliness
Ever wonder why a spotless tray makes such a difference? You’ll notice that sample tray cleanliness directly influences color measurements, so wipe the tray with a lint‑free cloth and inspect for residue before each roast.
Next, place a small, fresh batch of grounds—no old crumbs—to avoid contamination that could skew the meter. Keep grind settings identical and follow the same preparation protocol every time; this reduces variability and lets you spot drift quickly.
If readings fall outside the expected range, recalibrate liberally, using the clean tray as your baseline.
Track weight loss alongside color results; discrepancies often point to tray issues or measurement error, letting you correct problems before they affect flavor development.
Run Standard Reference Sample
A clean, well‑calibrated meter is your best defense against color drift, so start each roast by running a Standard Reference Sample (SRS) that mirrors your usual bean type and roast level. First, tare the meter, then measure the whole‑bean SRS. Grind the beans to a consistent setting, measure the ground sample, and record both color readings. If either reading falls outside the expected range, perform a liberal recalibration before proceeding. This quick routine anchors your measurements, catches anomalies early, and keeps batch‑to‑batch consistency.
- Tare, then measure whole‑bean SRS
- Grind, measure ground SRS, record color readings
- Compare both values; recalibrate if out of range
Translating RGB/Agtron Values Into Real‑World Flavor Profiles
Ever wondered how a simple RGB or Agtron reading can tell you exactly what flavors will emerge in your cup? When you capture a roast’s color with an Agtron disc or an RGB sensor, you’re getting an objective proxy for the degree of Maillard and caramelization reactions. Those reactions dictate the balance between chocolate, nutty, and caramel notes. By calibrating your probe before each batch and cross‑checking weight loss, you can translate a 55 Agtron value into a medium‑dark flavor profile rich in bittersweet chocolate and toasted almond. Real‑time tracking lets you map color trajectories to aroma intensity, so a rapid shift from 45 to 60 RGB signals a surge in caramel sweetness. Consistent color measurements across whole‑bean and ground samples sharpen your QC, ensuring each roast hits its target flavor.
Managing Roast‑Color Variability With Repeats and Statistics
When you’ve turned RGB or Agtron numbers into flavor expectations, the next step is to keep those readings reliable across batches. You’ll run at least three repeats per batch, averaging the results to smooth out sensor noise and bean‑to‑bean differences. Calibrate the spectrometer before each roast and re‑calibrate immediately if any reading strays beyond your tolerance window. Compare the averaged color analysis to the corresponding weight‑loss data; discrepancies flag potential process drift. Track batch‑level metrics—RD value, standard deviation, and distribution—to monitor uniformity over time and spot trends before they affect flavor.
Repeat measurements three times, average, calibrate before each roast, and monitor batch metrics for consistent flavor.
- Perform three repeat measurements and average them.
- Calibrate before each session and after out‑of‑range readings.
- Use batch metrics (RD, SD, distribution) for ongoing quality control.
Color‑Based QC: Combining Color and Weight‑Loss Data
You’ll start by integrating color and weight‑loss metrics so each roast gets a single, actionable score. As the beans cool, the system correlates real‑time loss with color readings, flagging any mismatch the. When a stable color meets a weight‑loss threshold, you trigger a QC alert; if the two diverge, you know a recalibration or process tweak is needed.
Integrated Color‑Weight Metrics
Why rely on color alone when weight loss can confirm your roast’s progress? You’ll notice that a mismatch between color and weight loss flags a roasting error, prompting recalibration. Measure both whole‑bean and ground color to catch interior underdevelopment, and keep sample handling consistent—same grind, tray size, and timing as beans leave the cooling tray. Recalibrate your color meter before each batch, especially when readings drift, and use weight‑loss trajectories as a complementary proxy. Apply a color‑degree framework with a central reference and palette, then overlay weight‑loss curves to monitor batch consistency and guide profile tweaks.
- Pair whole‑bean and ground color data with weight‑loss trends.
- Standardize grind settings, tray dimensions, and read‑time.
- Recalibrate meters when color deviates, using weight loss as a check.
Real‑Time Loss Correlation
Integrating weight‑loss data with real‑time color monitoring turns a single‑parameter check into a dual‑signal quality control system. You watch surface roast color shift while OmniFlux logs loss‑of‑mass, then match the two curves instantly. If the color curve accelerates but weight loss lags, you know the heat is overshooting the bean’s moisture release, prompting a quick reduction in energy input. Recalibrate the color meter before each batch and take repeated readings; this tightens the correlation and catches subtle deviations.
Pair whole‑bean color with ground‑color checks to reveal uneven development that weight loss alone might hide. By treating weight loss as a complementary proxy, you create a robust QC framework that safeguards flavor consistency across every roast.
Threshold‑Based QC Alerts
How do you catch a roast that’s straying off the flavor map before it spoils the batch? You set threshold‑based QC alerts that fire when color readings and weight loss diverge from their expected windows. First, recalibrate your color meter before each roast and again if several readings drift. Then, capture color readings as beans leave the cooling tray and immediately compare them to the observed weight loss. If the color progression suggests Maillard advancement but the weight‑loss trend lags—or vice‑versa—you trigger an investigation and adjust the profile.
- Calibrate meters, then monitor color readings + weight loss in real time.
- Define acceptable deviation bands for each metric.
- Flag any mismatch as a QC alert for corrective action.
Build a Roast‑Color Library for Consistent Flavor Outcomes
When you standardize grind size, sample‑tray dose, and repeat measurements, you create a reliable roast‑color library that ties each hue to a specific flavor profile. Use a centralized reference like Agtron or standardized color tiles to compare roast color across machines and batch sizes. Record the progression from green through yellow, brown, and dark, noting aroma, surface texture, and development stage cues for each shade. Capture both whole‑bean and ground‑bean readings, flagging discrepancies with weight‑loss data to spot uneven development or measurement error. Calibrate your color tool before every roast, then cross‑check with weight loss as a secondary proxy. This disciplined approach keeps your library consistent, ensuring predictable flavor development every time.
Frequently Asked Questions
How Does Ambient Humidity Affect Roast Color Consistency?
You’ll see humidity slows moisture loss, so beans stay darker longer, causing uneven color. High humidity makes the surface stay cooler, yielding lighter spots, while low humidity promotes faster, more uniform browning.
Can Color Readings Predict Caffeine Degradation Levels?
You can’t rely solely on color readings to predict caffeine degradation; they indicate Maillard progress, not chemical breakdown. Use chromatography or spectrometry for accurate caffeine loss measurements.
Do Different Bean Origins Require Unique Color Calibration Curves?
Yes, you’ll need distinct calibration curves for each origin because bean composition, moisture, and pigment profiles differ, affecting how color correlates with roast level and flavor development.
What Impact Does Pre‑Roast Bean Moisture Have on Agtron Values?
You’ll see higher agtron values when beans retain more moisture before roasting; the extra water slows Maillard reactions, yielding lighter colors, while drier beans roast faster and produce darker, lower‑agtron readings.
Is There a Standard Color Tolerance for Commercial Batch Acceptance?
You’ll find that most roasters use a ±2‑ΔAgtron tolerance for batch acceptance; it balances consistency and flexibility, ensuring each roast stays within the target color window without over‑tightening specifications.
In Summary
By mastering color analysis, you’ll control roast development faster and more precisely than tweaking temperature alone. Choose a reliable meter, keep sample trays consistent, and match grind size to your sensor’s depth. Take readings after a brief cool‑down or use real‑time scans for tighter feedback loops. Translate RGB or Agtron numbers into flavor cues, track variability with repeats, and blend color data with weight‑loss metrics. Build a robust color library, and you’ll consistently hit the flavor profiles you’ve engineered.


